Project Overview
This project focused on the development and validation of a real-time Data Acquisition (DAQ) system for measuring aerodynamic lift on a NACA 0012 airfoil inside a low-speed open-circuit wind tunnel.
The primary objective was to integrate strain-gauge-based load measurement with LabVIEW-based signal acquisition, calibrate the system, and compare experimental lift data against Computational Fluid Dynamics (CFD) predictions.
The work involved three major components:
- Load cell calibration and instrumentation setup
- CFD simulation of NACA 0012 airfoil in ANSYS Fluent
- Experimental lift measurement and validation
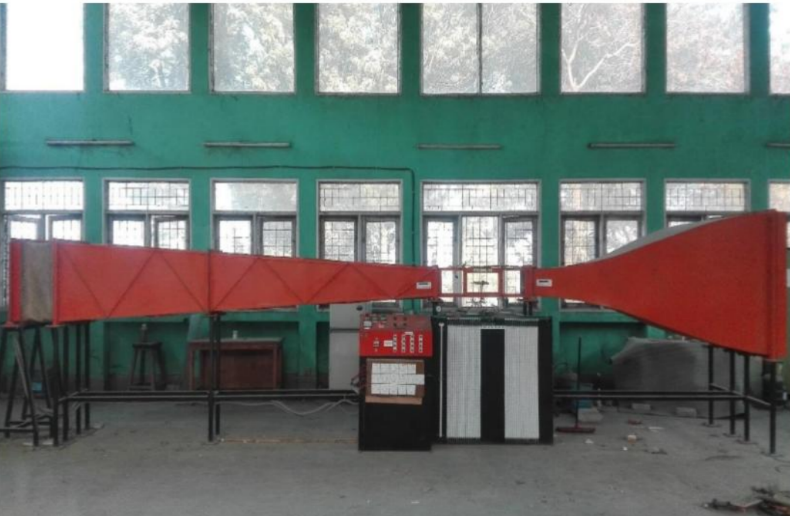
Wind Tunnel and Flow Conditions
The experiment was conducted in an open-loop subsonic wind tunnel with:
- Test section: 250 mm × 250 mm
- Maximum attainable velocity: 12 m/s
- Operational velocity during experiment: 9.85 m/s
- Air density at 20°C: 1.018 kg/m³
- Reynolds number: 2.747 × 10⁴
The airfoil tested was a NACA 0012 symmetric airfoil with:
- Chord length: 0.045 m
- Span: 0.248 m
- Reference area: 0.0116 m²
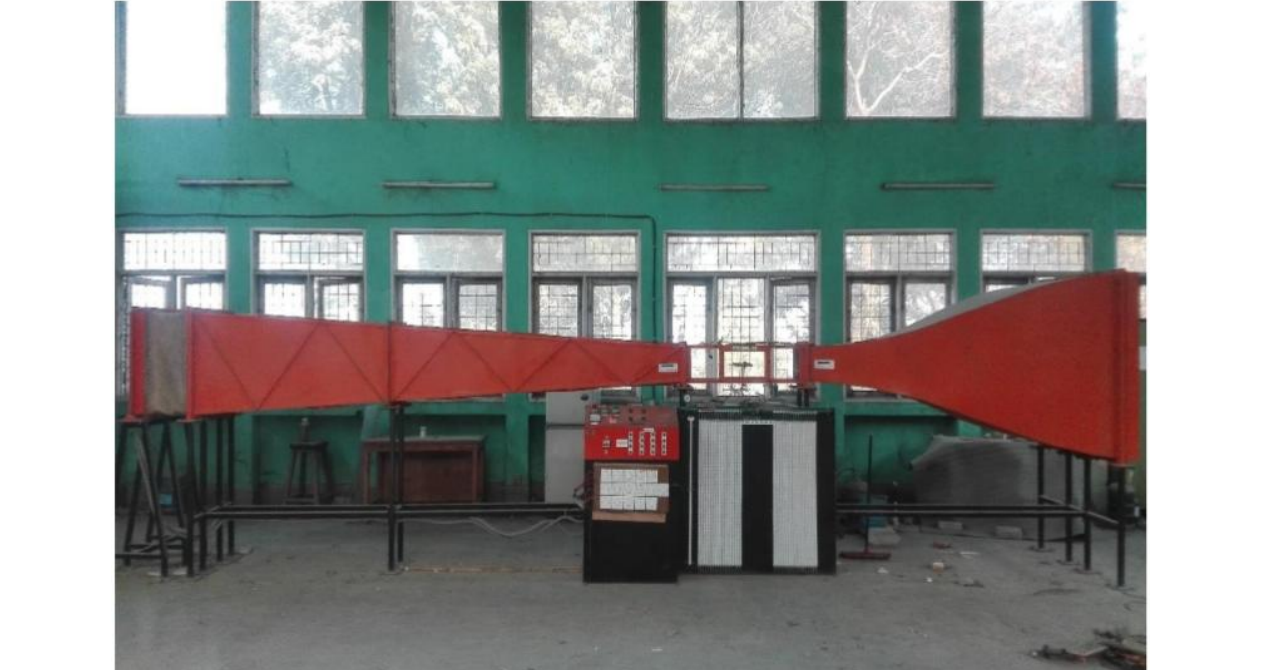
Fig: Open-circuit wind tunnel used for aerodynamic testing.
Instrumentation and Load Measurement
Lift forces were measured using a strain-gauge load cell mounted on a cantilever-type support structure. The load cell operated on the Wheatstone bridge principle, converting strain-induced resistance changes into measurable voltage signals.
Load Cell Specifications
- 5 kg capacity strain gauge load cell
- Operating voltage: 2.6–5.5 V
- Gauge factor ≈ 2
- Signal wires connected to NI SCB-68 DAQ board
A five-point calibration procedure was performed using known weights. The calibration constant was determined as:
Lift = −1.9203 × Voltage − 0.5019
The regression coefficient (R² = 0.9263) confirmed near-linear load cell behavior within the operating range.
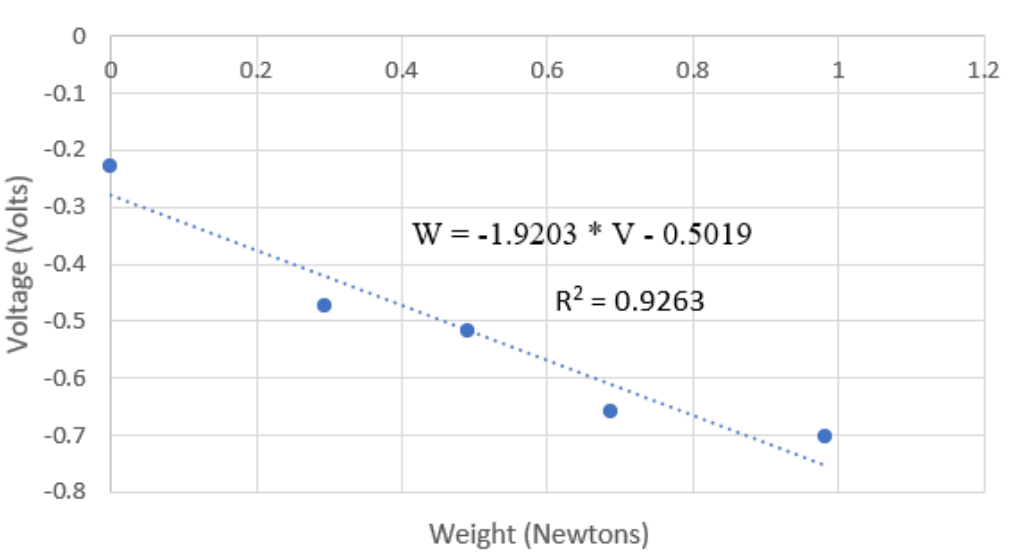
Fig: Load cell calibration curve and linear regression fit.
Data Acquisition System Architecture
The instrumentation chain consisted of:
Strain Gauge → Amplifier → NI SCB-68 DAQ → LabVIEW → Data Processing
The NI SCB-68 shielded connector block enabled analog-to-digital conversion and signal conditioning. Data was sampled at 1000 samples per second for 20 seconds per angle of attack.
Bias correction was implemented by recording voltage at zero wind speed and subtracting it from loaded measurements.
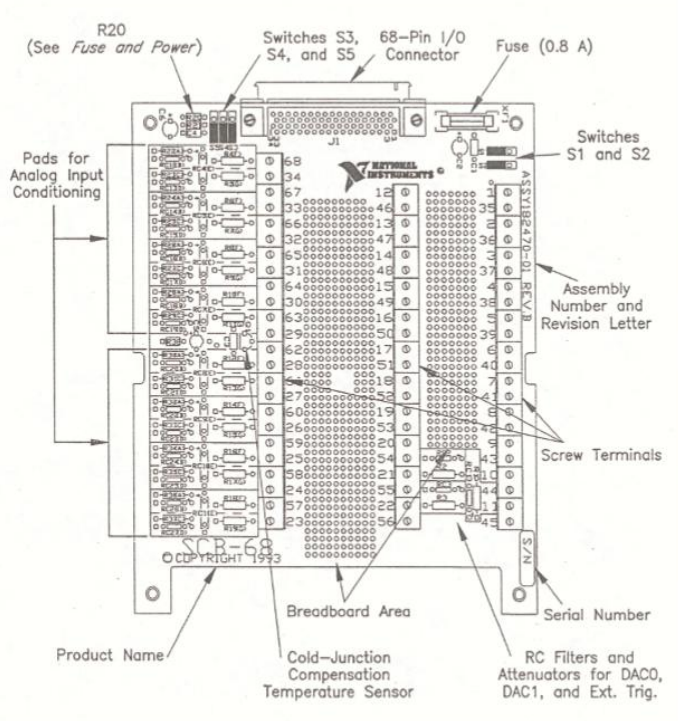
Fig: NI SCB-68 DAQ system used for signal acquisition and conditioning.
CFD Simulation – ANSYS Fluent
To validate experimental results, CFD simulations were performed for multiple angles of attack.
Simulation Setup
- Solver: ANSYS Fluent
- Mesh: Structured C-grid
- Turbulence model: k–ε model
- Residual convergence criteria: 0.001
- Boundary conditions:
- Velocity inlet: 9.85 m/s
- Pressure outlet: 0 Pa gauge
- No-slip wall at airfoil surface
Lift and drag coefficients were monitored across AOA from −4° to 15°.
Maximum lift coefficient observed in CFD:
Cl = 0.691 at AOA ≈ 14°
Stall was predicted at approximately 14°.
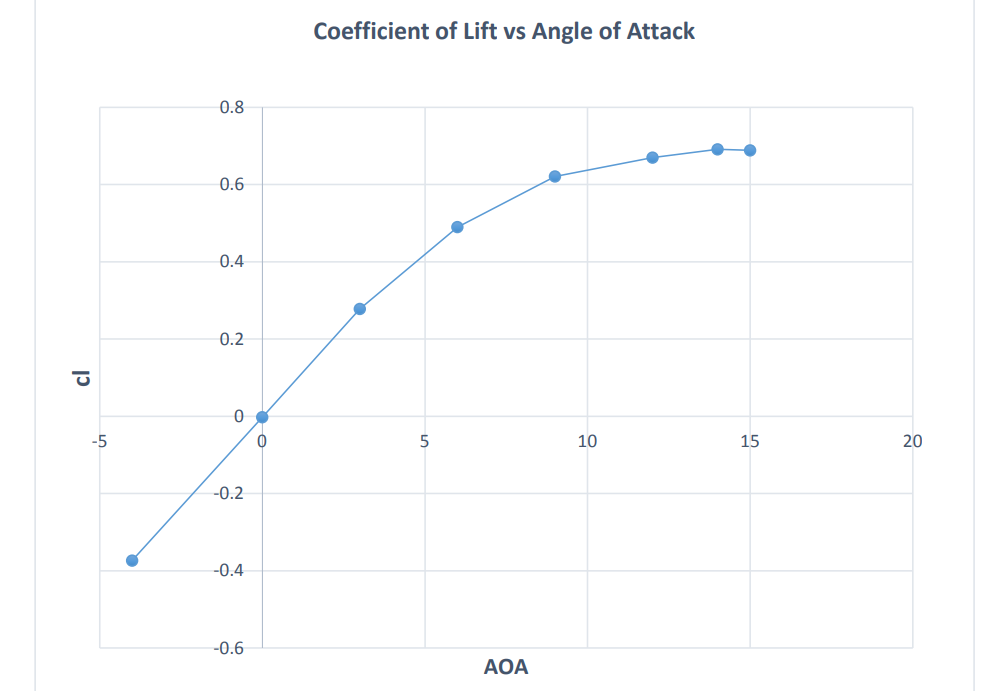
Fig: CFD lift coefficient variation with angle of attack.
Experimental Results
Lift coefficient increased linearly with angle of attack until stall, consistent with thin airfoil theory.
Maximum experimental lift coefficient:
Cl ≈ 0.628 at AOA ≈ 12°
The stall angle experimentally was observed between 12° and 15°.
Minor deviation between CFD and experimental results was attributed to:
- Surface roughness
- Mounting rigidity limitations
- Amplifier noise
- Unknown turbulence intensity
- Experimental bias and calibration limitations
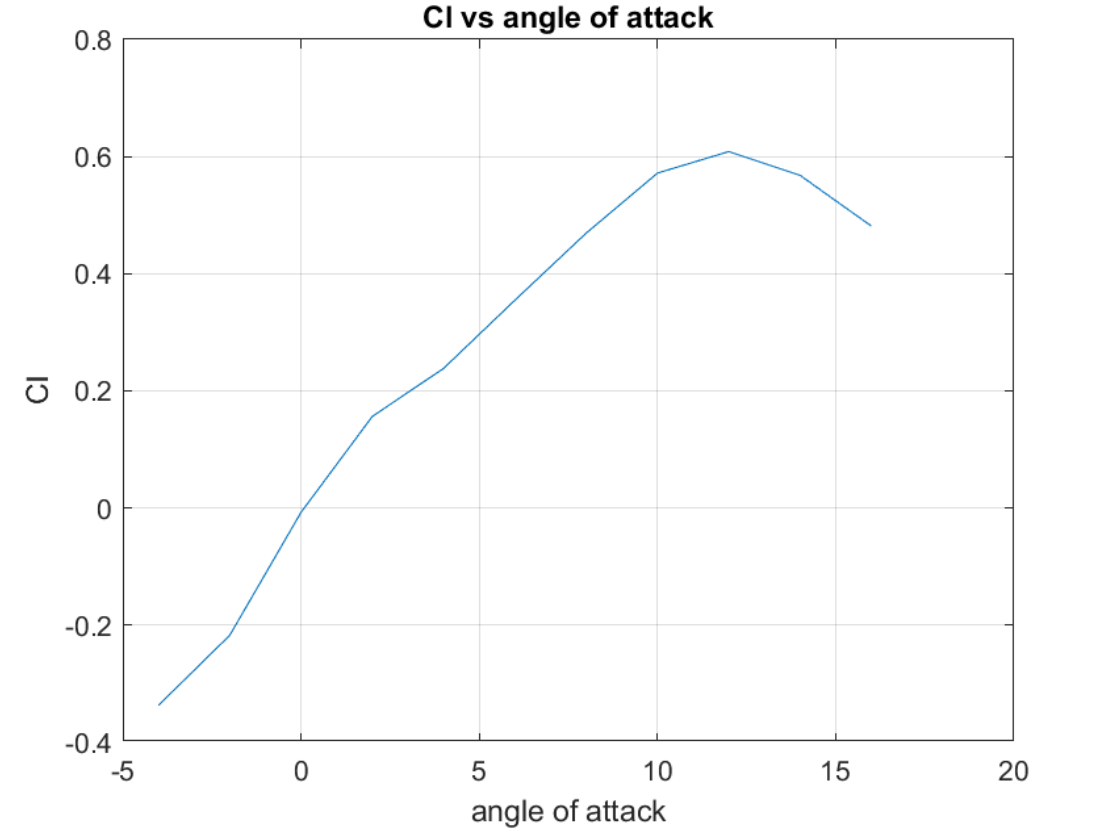
Fig: Experimental lift coefficient variation with angle of attack.
Technical Contributions
This project demonstrates:
- Integration of strain-gauge instrumentation with NI DAQ systems
- LabVIEW-based real-time data acquisition
- Load cell calibration and regression analysis
- CFD simulation of low Reynolds number airfoil flow
- Experimental validation of aerodynamic coefficients
- Signal processing and noise handling
- MATLAB-based post-processing and visualization
The project validated the capability of the developed DAQ system to produce experimentally consistent aerodynamic data while identifying real-world limitations in measurement fidelity.